
Excel Tables & Tabular Data
Excel Data
Learning to structure your excel data in a tabular format and loading it to Excel tables will make it easier for analyzing and finding valuable insights into your data.
When working with data in Excel, one should store data in Excel tables in a tabular data format when possible.
Microsoft Excel is designed to work best with tabular data, which is true for Pivot Tables, Power Pivot, Excel Tables, and dashboards.
This post will discuss Excel tables and tabular data. We will start by discussing Excel tables, what they are and why you should use them, and then transition into discussing Tabular data.
Excel Tables
Excel tables are designed to make managing and analyzing a data set easier in Excel. With tables, you can quickly turn a range of cells into an Excel table. Some of the benefits of an Excel Table include:
Makes managing and analyzing your data easier, including sorting, filtering, updating, and analyzing data in a pivot table
Understanding and using tables is a necessity for using Power Query and Power Pivot
Tables turn your data into a structured data set, and the named formulas that tables use are easier to follow and audit than regular excel formulas
Listed below are three blogs I recommend for learning more about Excel Tables.
Recommended Blogs on Excel Tables
The first recommended blog comes from Dave Bruns at ExcelJet.
The article provides a list of 23 reasons why you should use tables, and a few of these benefits include:
Creating tables is fast
Painless drag and drop
Tables expand automatically
Easy dynamic ranges
Use a table with a pivot table
To see all the benefits of tables, check out his blog.
Overview of Excel tables (microsoft.com)
The second recommended blog comes to us from Microsoft Support and is titled Overview of Excel Tables. The articles teaches the elements of an Excel table, how to create a table, and how to ensure you are working efficiently with your data.
Tables in Excel - Easy Excel Tutorial
The final recommended blog for tables comes to us from Excel Easy and Niels Weterings. The blog is easy to follow and walks us through the basics of creating and working with an Excel table. In addition to the blog, he also includes an Excel file we can download and use as we follow the blog.
Next are a few YouTube videos that we can use.
Recommended Videos on Excel Tables
The first video is titled Excel-Getting Started with Tables and is from Mynda Treacy at My Online Training Hub. This thirteen-minute video will provide you with an excellent overview of Excel tables, including:
A solid overview of what tables are and why to use them
How to use different styles with tables
How the name manager works with tables
How the total column works in Tables
And much more
This is an excellent video for someone wanting an overview of Excel tables.
The second video is titled "Everything You Need to Know about Excel tables " by John Macdougall. After watching this video, you will understand what excel tables are and how to use them.
Next, let's talk about tabular data and how to make sure your data is in a tabular format to take full advantage of all the benefits of an Excel table.
Tabular Data
Unfortunately, the data we receive is often not in a tabular format. The data is often in a pivot format or another structure that does not lend itself to easy analysis.
Before learning how to use Pivot Tables, one should know what tabular data is and how to convert data to a
tabular format.
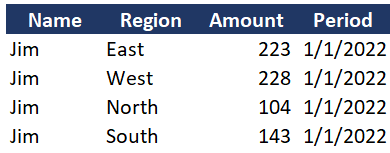
Data format for analyzing data in excel (Tabular Data):
1. Column headers in one row
2. Each data record is in one row, and each row contains a complete recordset
3. No blank rows in the data
4. No subtotals throughout the data
5. Each field/column houses its own type of data (i.e., Month, Product, amount, geographic region, etc.)
Tabular data needs to follow the above principles. If your data is not in this format, you will need to fix it. For more on tabular data principles, go to the following blog:
Excel Tabular Data • Excel Table • My Online Training Hub.
Normalizing the data into tabular format can be done with Excel formulas or Power Query. Strongly recommend learning POWER QUERY for cleaning and converting your data before conducting data analysis.
In the next section, I will provide some great blogs and videos for learning more about tabular data and working with tabular data in Excel. Your analysis will be much easier once you master tabular data and convert your datasets to tabular data.
Recommended Blogs on Tabular Data
The first recommended blog comes to us from Jon Acampora.
How to Setup Source Data for Pivot Tables - Unpivot in Excel (excelcampus.com)
This guide walks us through structuring data for analyzing it in pivot tables. The guide is a little dated as it was written in 2013, but it is still relevant today. He mentions that Power Query is only available as an add-in, but today it is native to Excel. No add-in is required.
The blog also includes a video that explains the unpivot process that I walk through in my guide.
The second blog I recommend is from My Online Training Hub, written by Mynda Treacy, and is also from 2013.
Excel Tabular Data • Excel Table • My Online Training Hub
This blog walks through what a perfect tabular data set looks like and what needs to be included for the data to be normalized. The blog explains the different types of data we will often see and what is wrong with each type. These include
Semi-Report - Has some degree of summarizing in the data
Flat Data - A flat data can be used in a pivot table, but it has some summarizing which makes it challenging to conduct an analysis
Data Entry Format - This is a format designed for easy entering of data, not analyzing data
Report Format - This is when the data already comes in a friendly, formatted data type
Multi-Sheet Format - This is when the data is spread out on multiple spreadsheets
After discussing each type, she provides three methods to use for fixing the data.
The third blog comes from Jeff Lenning at Excel University. This example walks through converting a crosstab dataset to a tabular dataset by unpivoting the data using the Unpivot functionality in Excel.
Unpivot Excel Data - Excel University (excel-university.com)
Next, we will provide a couple of video resources for learning more about tabular data and unpivoting data in Excel.
Recommended Excel Tabular Data Videos
The first video is from Myexcelonline.com by John Michaloudis. The video discusses what a tabular data set is and how to put it into a pivot table.
The next two videos are from Leila Gharani. The first shows how to convert columns to rows in Excel using the unpviot function in Power Query.
First Video
Second Video
The second video is about how to unpivot more complex data with multiple headers using Power Query.
Conclusion
If you hope to be proficient at conducting analysis in Excel, then you must learn about Excel tables and how to convert data to a proper tabular dataset. By reading the blogs, watching the videos, and practicing the example, you will be well on your way to becoming a better analyst.