
The 4 Key Pillars of FP&A Planning Tools
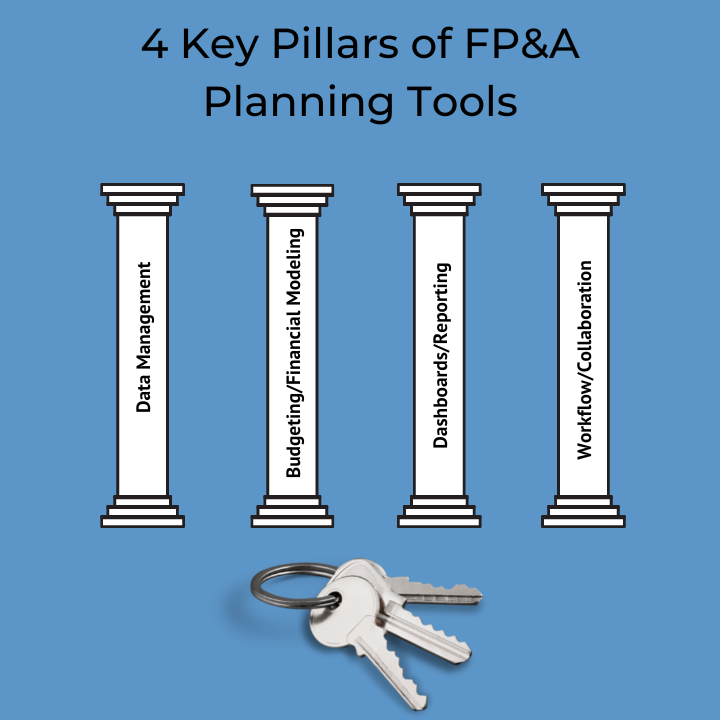
FP&A planning tools have 4 key pillars:
Data Management
Budgeting/Financial Modeling
Dashboards/Reporting
Workflow/Collaboration
In this blog post, we discuss the 4 pillars and what one should think about when looking to purchase a planning tool.
Data Management
The first key pillar of a planning tool is data management and how the tool manages your data. Finance has often lagged behind other departments in data management and integration. There are two main reasons for this:
A heavy dependency on Excel as Excel is not an enterprise-scale data management tool
A need to integrate with multiple data sources across multiple business departments
When reviewing a planning tool, an area of focus should be how they manage data because:
Data prep, cleaning, and consolidation is a major pain point for FP&A professionals everywhere
If you get the data management wrong, the rest of the tool quickly loses value
In our upcoming FP&A market guide, we spent a lot of time understanding what systems FP&A vendors integrate with and how they bring the data together.
Generally, a planning tool will build a data model and natively integrate with at least 3 corporate systems.
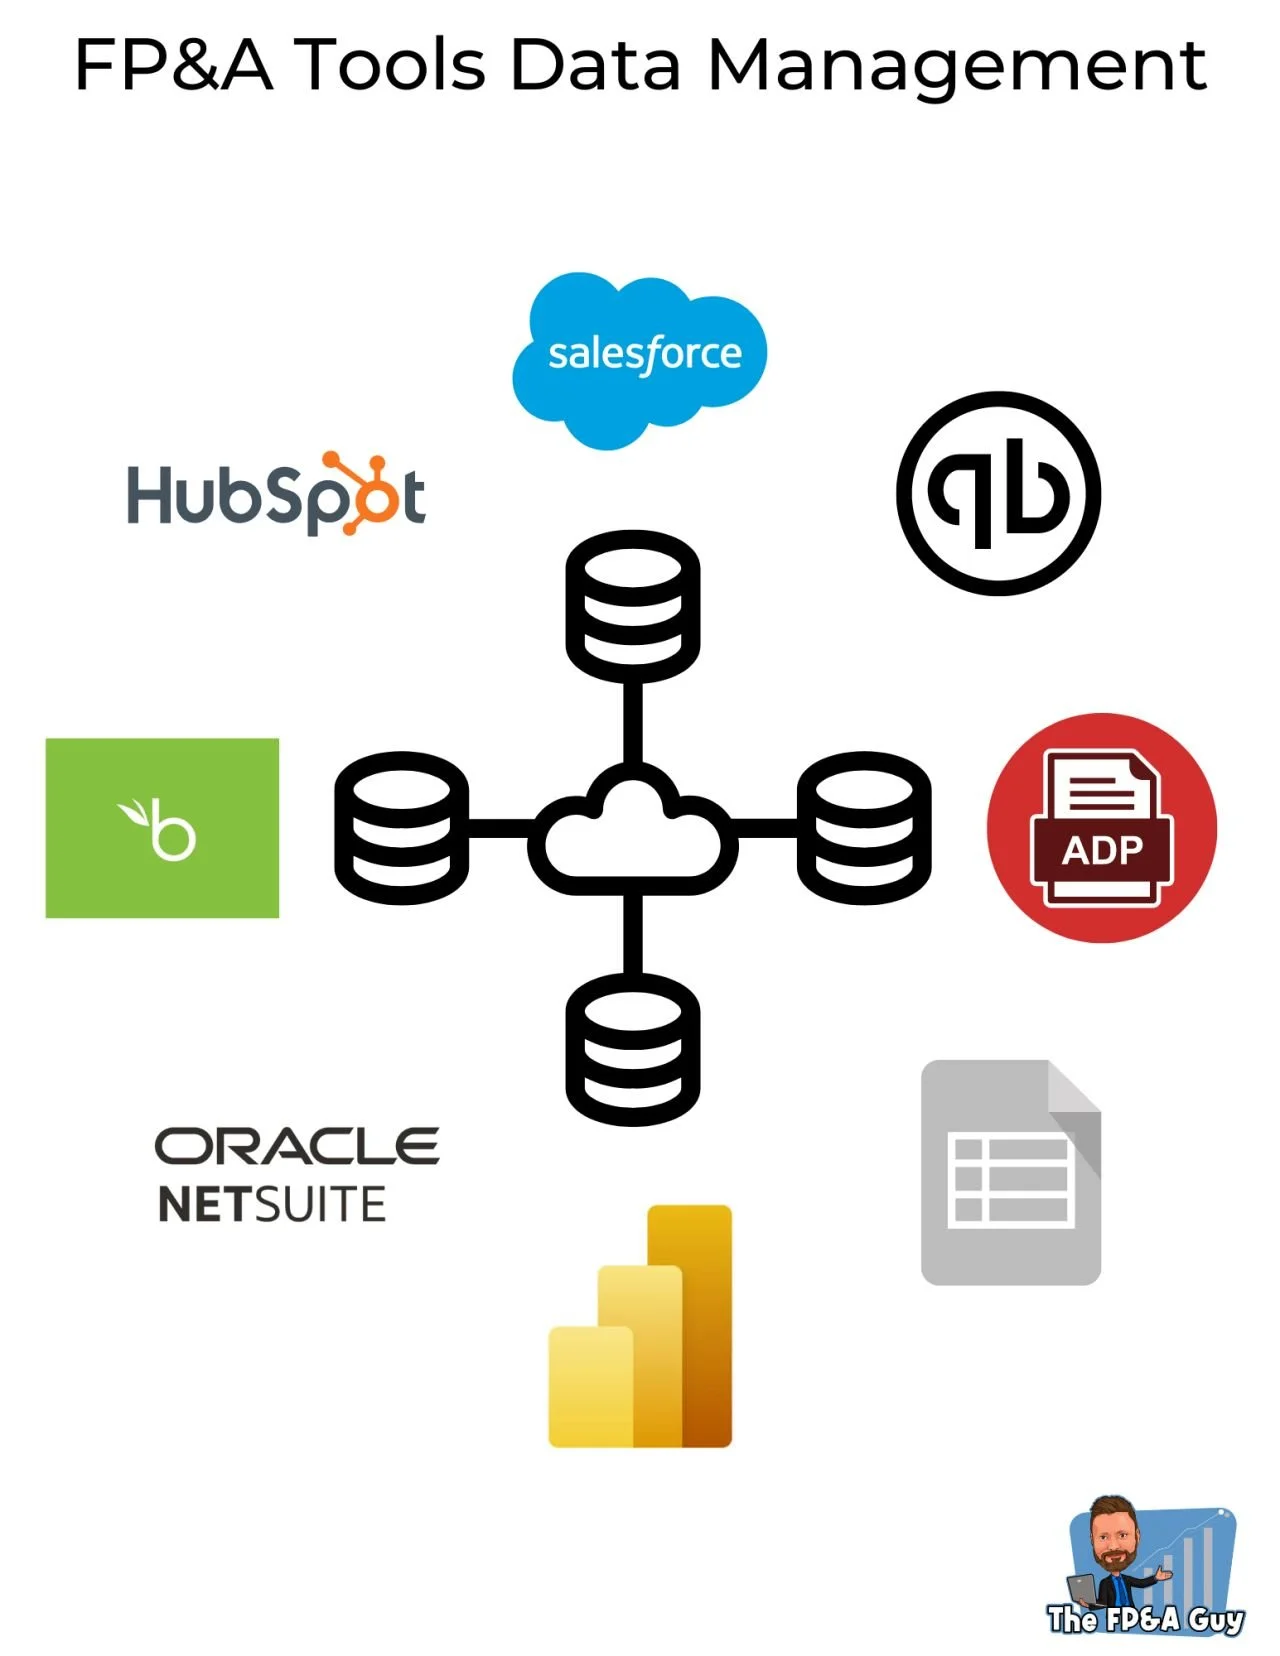
ERP - The backbone of any planning tool is the chart of accounts and how they bring in your accounting data.
Things to consider:
How many dimensions and attributes can they manage
Degree of flexibility in structuring the data model
What rules and configuration logic do they use for managing the model
Do they bring in a summary of the chart of accounts, or do they bring in transactional level data
Most tools will have a native integration to the ERP with a set of business logic for managing the data. Which ERP vendor a tool integrates with depends on the size of customer they are targeting.
Tools aimed at small to mid-market typically integrate with QuickBooks, Zero, Sage, and NetSuite. Larger tools will often integrate with the above-listed tools in addition to Oracle, SAP, and a variety of other ERP's.
CRM - Having CRM data available in a planning tool is incredibly helpful for revenue planning. With this in mind most planning tools integrate with CRMs and bring in data about sales opportunities. As a general rule most tools will have a native integration with at least one or more of the 3 major CRM's: Salesforce, HubSpot, and PipeDrive.
HRIS - Most tools will bring in your employee data. The employee data will typically be integrated into an HR planning module. Most tools at a minimum, bring in key data points on every employee, including salary, start data, role, employee ID, etc. Many different HR platforms exist, and most tools integrate with at least 3 or 4 different HR tools.
In addition to the above, some tools will integrate directly with billing systems, data warehouses, applicant tracking systems, etc.
Understanding how a planning tool thinks about and manages data is very important. A planning tool that helps FP&A get this right will save FP&A teams many hours of time working with data and will greatly increase the value of a planning tool. Get it wrong, and your team may find itself hiring an expensive consultant to fix it or spend a lot of time back in Excel.
Budgeting/Financial Modeling
The second key pillar of a planning tool is the budgeting and financial modeling capabilities. The key components that impact the ability to build budgets and financial models in a planning tool are:
The data model and what dimensions are available for model building
The calculation engine the tool uses
The syntax used to develop a model
The trade-off between structure and flexibility
The planning models available in the tool
Modeling is the area of the planning tool that is hardest to get right, which is why so many companies end up back in Excel. The flexibility of spreadsheets, especially Excel, is one area that is hard to beat, and creating a calculation engine that operates with the structure of a database on the back end and the flexibility of a spreadsheet on the front end is hard. With this in mind, listed below are 5 things to keep in mind when thinking about the modeling capabilities of your planning tool.
Data Model - what dimensions are included in the model? Can one plan by week, month, quarter, etc.? Can one plan using custom roll-ups and hierarchies or only the dimensions in the chart of accounts?
Calculation Engine - The calculation engine is core to modeling. What approach does the company take to modeling? Do they use Excel, Google Sheets, a custom spreadsheet, multidimensional modeling, or a combination? Companies should spend a lot of time understanding this, so they do not buy a planning tool and continue using Excel. Will the tool allow one to do the modeling required to build a robust plan? Can it support loading financial modeling spreadsheets into the tool? Can it handle the complexity of your business? Taking the time to understand how a tool manages modeling is critical. If the goal of your team is to continue using Excel and you want a planning tool for data management, version control, security, etc, then select a tool built around Excel, as several options exist.
Modeling Syntax - How complex is the syntax? Is it all custom, and will it require a consultant or a dedicated resource every time changes need to be made to the model, or is it a low code/ no code, and changes can be made by the team? Some of the most powerful tools on the market require a specialist to modify the code when making changes to your models.
Structure vs. Flexibility - Make sure to understand how flexible the tool is when it comes to modeling. Does the tool have the ability to build custom templates, or must one select from a pre-defined set of templates? Does the tool support creating custom drivers and metrics for modeling, or does it limit one to only a few options when building models?
Planning Model - Make sure to review and understand what levels of modeling the tool supports. Does it have a headcount model, and can it support capacity, role, and person-based planning? Can revenue and expense planning support both a top-down and bottom-up build? Does it support only financial planning, or will it also support operational planning within the tool?
The bottom line is planning tools continue to get better, and the flexibility to model many different scenarios continues to improve. Still, no matter how flexible the planning tool claims to be, one will make tradeoffs when switching from a spreadsheet to a planning tool.
Keeping this in mind throughout the selection process will reduce the chances of selecting a tool that will not meet the business needs.
Dashboards/Reporting
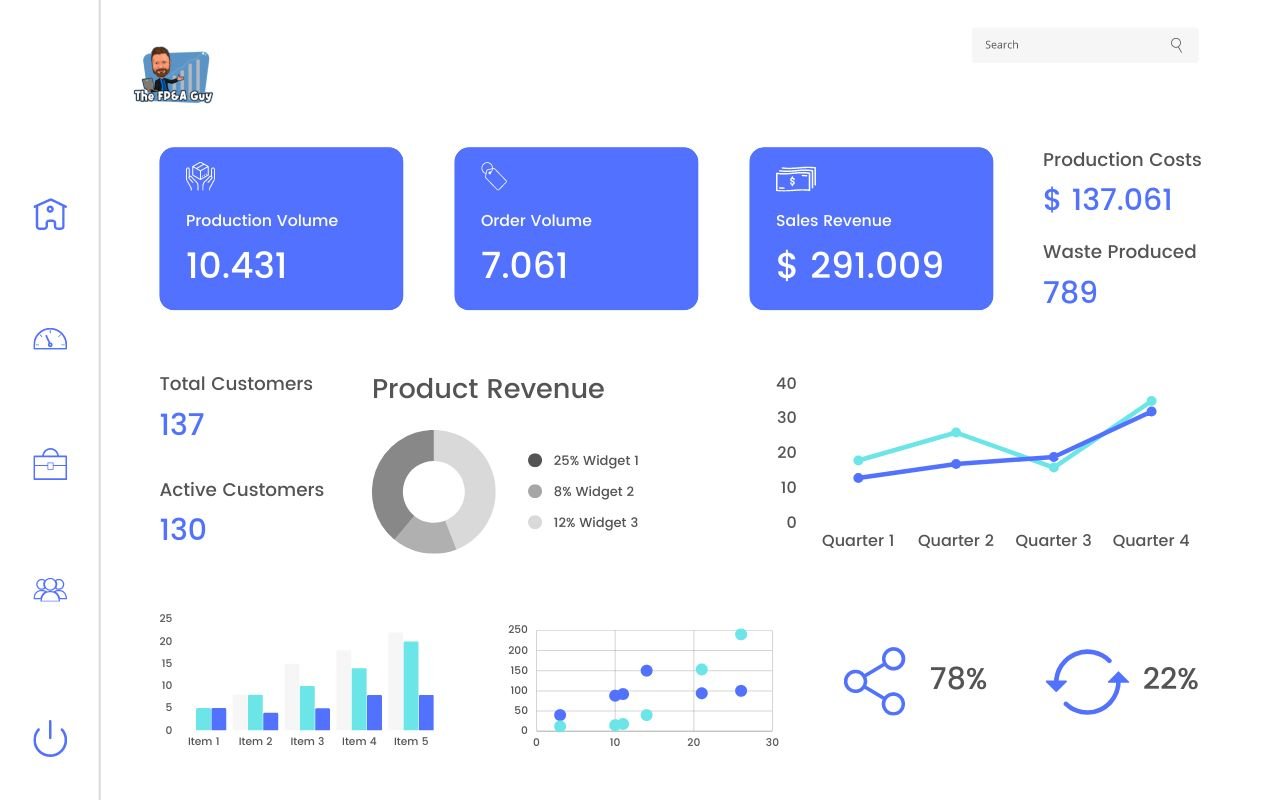
The third key pillar of an FP&A planning tool is dashboarding and reporting. The FP&A team provides many different types of reporting to the business:
Board Decks
Management Reporting
Month-End Financial Reporting
Various Operational Reports
Flux Analysis
Ad hoc Reporting
The average FP&A department often spends a great deal of time preparing various reports for the leadership team. Anyone who has worked in finance has probably stayed up late preparing a board deck or a management report for leadership. This has often involved creating many graphs and charts in an Excel sheet and then linking them to a PowerPoint (PPT) deck or, in some cases, copying and pasting from Excel to PPT.
When selecting an FP&A tool, it is important to choose one that will help automate and streamline the reporting process your company uses.
Some things to consider when reviewing dashboarding and reporting:
How well does it integrate with PPT, Google Slides, and Excel?
Can the data easily be connected with a BI tool (Power BI, Tableaus, etc.)?
Can one bring in outside data to the tool?
Can one create custom reports and metrics, or are you limited in what reports are available?
How does the licensing work for sharing reports?
What formats can you save reports in PDF, Excel, etc.?
Can one combine different visuals together into my own dashboard, can I comment on reports?
How many different visuals are available, and what formatting, and color options do I have?
When reviewing reporting/dashboarding capabilities, it is important to understand how the tool thinks about and solves for reporting and dashboarding. Some tools have a high degree of flexibility and formatting, and others are limited in what you can report and visualize.
One needs to think not only about the reporting/dashboarding needs of today but also what they will be in 1 year, 3 years, 5 years, and then how this tool will work with other BI tools and potentially a data warehouse.
The last thing one wants to do is select a tool only to find out it cannot support the team’s current reporting needs, and the team is left exporting data to Excel and missing out on the benefits that reporting and dashboarding within an FP&A tool can provide.
When done correctly, implementing an FP&A tool will help streamline and automate your entire FP&A department's reporting needs. Done incorrectly, it becomes a tool with some pretty visuals that nobody ever uses.
Workflow/Collaboration
The fourth pillar of an FP&A planning tool is workflow/collaboration. For an FP&A department to be considered best-in-class, they have to work closely with other departments throughout the business. Historically this close collaboration has been missing in many FP&A departments, and it has caused a major disconnect between financial and operational plans.
The need for greater collaboration is why we are seeing a lot of new marketing buzzwords designed to emphasize this importance. Gartner coined the phrase XP&A to emphasize the need for FP&A to be companywide. Other planning tools have coined the terms continuous, connected, and integrated planning to emphasize the importance of combining operational and financial planning together.
Other tools have started calling themselves strategic finance platforms to emphasize the need for company-wide strategic collaboration.
In order for an FP&A tool to support this level of planning, it must have a robust approach to managing workflow and collaboration throughout the entire planning process. The ability to collaborate is what allows the FP&A planning tool to become a company-wide tool for planning that is owned by FP&A but used throughout the company.
When it comes to workflow a few things to keep in mind:
Does the tool allow for multiple departments and people to be included in a workflow?
Can I create my own custom workflows, or am I limited to certain pre-defined workflows?
Can I have more than one level of approvals in a workflow?
Does the workflow include the ability to notify people they have a workflow within the system?
Can I assign a person and a date to each item in the workflow?
When it comes to collaboration a few things to keep in mind:
Does the tool integrate with email, teams, slack, etc.?
At what level can I leave comments, on a specific data element, in dashboards, reports, etc.
Does it allow for threaded comments, can everyone respond to the comments?
Can one create notes for reports, for example, easily add BVA commentary for monthly reporting?
Does the software lisc. make it easy to add everyone to the tool for collaboration purposes?
Can one create custom views for the different departments and businesses?
Can one easily restrict what level of data each person can see and update?
When it comes to selecting a planning tool, one should spend time understanding how it manages workflow/collaboration and what one needs in a tool to support the business. If you are a small business with a finance team of one you might not need a lot in the way of workflow and collaboration, but if you are a large organization with many departments and people involved in the planning process workflow/collaboration may be a critical element to your planning tool.
The bottom line is to ensure you understand how your selection supports workflow/collaboration because integrating financial and operational planning in a strategic finance platform will benefit the entire organization.
Conclusion
With FP&A departments dealing with more and more data on a daily basis and spending up to 50% of their time doing low-value add tasks such as cleaning data having a planning tool that can help streamline and automate manual processes is becoming more important than ever. Furthermore, more and more tools exist in the marketplace than ever before, and this is why it is so important that companies spend time making sure the tool they select will support the finance department and keep them from ending up right back in Excel, where they started.