
Quantrix Business Modeler Product Review

Company Overview
Website: Quantrix
Year Founded: 2002
Headquarters: Portland, Maine
Quantrix was founded in 2002 and is owned by IDBS, a global science, and technology innovator that is part of the Danaher family of companies. Brad Hopper currently leads the Quantrix team as the General Manager and Chief Product Officer. Quantrix is an Enterprise grade multi-dimensional modeling tool. Quantrixd views itself as The World's Leading Business and Financial Modeling Platform, with over 1,000 customers in over 50 Countries.
In the words of General Manager Brad Hopper, Quantrix is a tool that is not out to replace spreadsheets for all use cases but is there to help with the more complex use cases that require the benefits of an enterprise application that has security, role permissions, audit logs, multi-dimensional modeling and more.
Product Overview
Before completing this write-up, three meetings were held with the Quantrix team (Brad Hopper and Lyndsey Weber). During these meetings, they showed how Quantrix would handle building an integrated 3-statement model and provided an overview of the tool. This review will primarily focus on the desktop modeling capabilities of the tool and provides very little focus on the cloud presentation layer, data integration, and the technical architecture behind the application. We have provided at the end of this document a list of capabilities claimed by Quantrix but not covered in this review.
Quantrix is an in-memory java-based multi-Dimensional enterprise business modeling application. To understand the power of Quantrix, one must recognize the benefits of multi-dimensional modeling. The traditional spreadsheet models work in two dimensions with rows and columns. With multi-dimensional modeling, you can add more dimensions to your worksheet. This allows you to add structure and link things together in ways that are not easy to do in a traditional spreadsheet. In this review, we will talk about the following features and functions of Quantrix.
Product layout
Formulas
Dependency Inspector
What-if Scenarios
Pivot Table Functionality
Relationship inheritance
Model Linking
Audit Capability
Quantrix Cloud
Product Layout
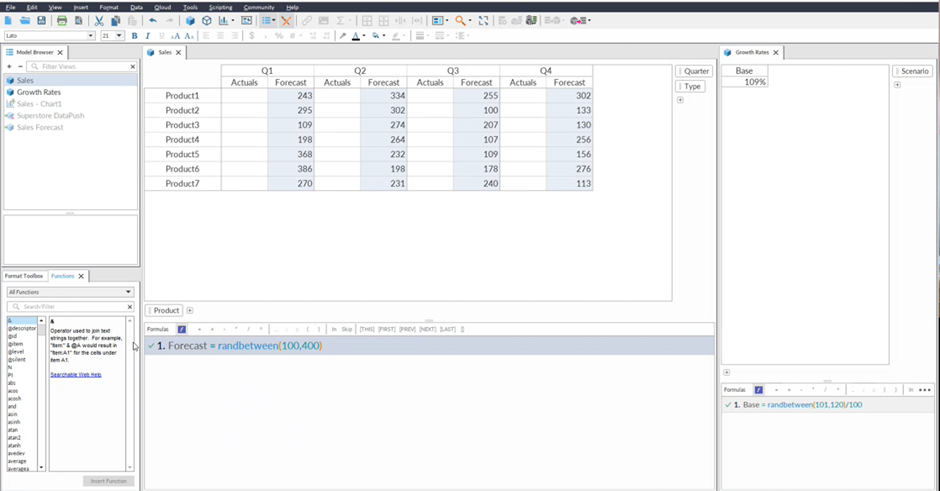
Quantrix Desktop Product Screenshot
Quantrix uses a matrix-like always-on-pivot table structure when creating models. The below screenshot shows what a simple model would look like in Quantrix. In this layout, you have the model browser that shows the different matrices/tables in your model, the sales and growth rate tab, and the formula sections for each data tab. The tool brings up different tabs on your screen, and you can quickly close and open other tabs from your model and rearrange the layout of the modeling canvas to meet your needs.
Within the tool, you can quickly move the different tabs around on the screen, and below is one example of what a layout might look like. In the below example, we have two modeling sections sales and growth rates. At the bottom of the data, we have the formula sections. What you will see is that Quantrix lists each formula separate from the data.
Formulas

Formulas Screenshot
Quantrix separates the data and the formulas into individual sections within the modeling canvas. From the screenshot below, you can see that each formula written for this cash forecast is listed at the bottom of the screen. You will also notice that the formulas are listed in natural language syntax. You reference a part of the model in the formula, not a row or column cell, as you would in spreadsheet modeling. One of the benefits of this modeling approach is that the formulas will automatically refresh when you make changes to the model. For example, if one were to add a region to the first model above, the formulas would inherit the relationship based on the structure of the model. One would not need to rewrite formulas to include the regions in the model’s layout. A significant benefit of this approach is that it makes it much easier to add new dimensions to the model without having to rewrite many of your formulas to incorporate this change. Another benefit of Quantrix is that everything is a named range and you do not have to reference cells in your formulas and formulas cannot be accidentally changed by editing cells. The formula bar includes an IntelliSense as you type a function and will give recommendations based on what you type. You can also click objects, which includes them in the formula bar as you are typing the model.
Dependency Inspector

Dependency Inspector Screenshot
Quantrix includes a built-in visual dependency inspector that makes it easy to see the path of a formula in the model, while displaying associated data. In the below example, the dependency inspector shows the path for Region 3, Product 1, Q2 sales forecast number of 447. You can see that the input is the Q1 forecast of 382 and the Region 3 growth rate of 117%. In the green box, you will see that Q2 has a value of 447, and you can see that it feeds the Q3 number of 523. The inspector also shows the formula used to calculate the 447 number. The formula is saying that for this quarter’s forecast, take the previous quarter to apply the growth rates to each region and skip the actuals. As you can see, the formula is written in a more natural language syntax than your typical spreadsheet formula. The dependency inspector makes it easy to understand/edit/audit the components of each of your formulas in an easy-to-follow visual layout.
Pivot Table Functionality
Quantrix has an always-on pivot table-like functionality. This allows you to easily change the view of your data without having to rewrite the underlying formulas. For example, in the above screenshot, if one wanted to change the regions from the rows to the columns, all one would need to do is relocate it to the columns and the formulas would automatically adjust, and one would be able to see the numbers in this new layout. The pivot-like functionality allows one the freedom to rearrange the data for any view desired without having to worry about the syntax on the underlying formulas.
Relationship Inheritance

Relationship Inheritance Screenshot
One major difference between Quantrix and your typical spreadsheet application is that everything within your model has a relationship inheritance, so you do not need to use any kind of lookup formula to bring data from one section to another. For example, if one wanted to add the quarter dimension to the growth rates, one could just drag and drop it on the growth rate tile, and it would automatically add the quarter time dimension. One could then update each quarter with its own growth rate, and one would not need to worry about doing any kind of lookup or formula changes for it to work.
What-if Scenarios

What-if Scenario Screenshot
One of my favorite features within Quantrix is the What-If scenario modeling. In the below example, we have a forecast for revenue, expenses, and gross profit. We have then created a scenario table with the sales growth rate and inflation rate as drivers. Next, we have a selection table where we create the different scenarios by selecting what values for the growth rate and inflation rate we want for each scenario. We can then easily add the scenario as a filter to the forecast layout and switch back and forth between different scenarios, and even change the driver inputs to the scenarios in real-time. Quantrix has done a great job of making it easy to conduct what-if scenarios and this is one of the stronger features of the tool.
Model Linking

Model Linking Screenshot
Within Quantrix, you can have multiple different models being built at the same time, and you can link the models together. If you want to bring in data from another model, you can go to import and add the section you want to link to your existing model. The data import can be scheduled to be updated on a regular frequency and allows you to easily combine different models together into one summary model. An example use case could be combining multiple different parts of the business together into one summary P&L for the business.
Audit Capability
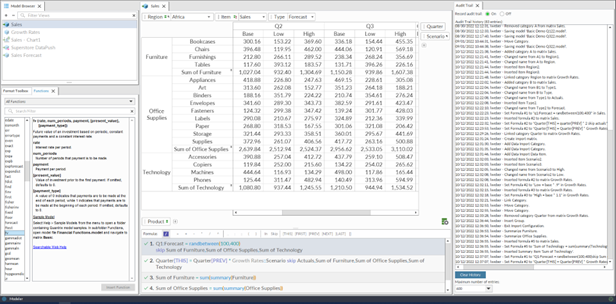
Audit Capability Screenshot
Quantrix includes full audit capability. You can turn on or off the audit trail and if you turn it on it will record every change you make to your model. In the below example, you can see all the changes that were made to the model. This functionality makes it easy for someone to review the model and audit all the changes from multiple authors or users in one easy log.
Quantrix Cloud

Quantrix Cloud Product Screenshot
Quantrix offers low code development to implement a model-based application/dashboards that might include instructions, interpretation and workflow. Quantrix Qloud is the mechanism that is used for online multi-user collaboration and end-user interaction with that model or application. Once a model has been built, and the dashboards have been created, you can allow people to interact with the model. You can publish standard templates to the web and everyone can create their own template instances online for each customer while maintaining the underlying functionality of the model. Quantrix has customers using its modeling tool and cloud applications for many different use cases including traditional finance processes like Budgets, Cash Flow and Forecasts but also strategic finance (M&A, Valuation), Supply Chain, CPQ (sales proposals). The below screenshot shows an example of what a CPQ app with workflow might look like in the cloud.
Product Opportunities
Quantrix has a lot to like, but it also has opportunities for improvement, including:
A full cloud version of the software
A new UI as the desktop Modeler UI is dated
Transparent online pricing
Final Verdict
Quantrix is a solid tool based on my research of the product and the demos received; I would go so far as to say it is one of my favorite modeling tools in the marketplace that I have demo’d todate. The tool has several benefits over the traditional spreadsheet and will serve many enterprises well. The UI is dated, and the tool might not be fully cloud, but it is still a solid Enerprise offering that is being used by many Fortune 500 companies today to model complex financial scenarios. If you want an Enterprise business modeling application that can handle a multitude of business use cases, then Quantrix is worth considering.
Additional Information
Implementation Time: Between 3 weeks and 3 months, the average implementation being around 6 weeks.
Platform: Client Desktop designer + Cloud SaaS (hosted or on-premises)
Pricing: Available upon request. Offers different types of user licenses based on company needs.
Data Integration: Provides the ability to connect with multiple data sources to push and pull data.
Syntax: Uses natural language syntax to write formulas and the Groovy built-in scripting language for more complex use cases.
Training: Quantrix has several free tutorials and training models for learning the software. Also, two YouTube channels exist where you can learn more about Quantrix. One is by hosted Quantrix, and another is by Rich Lopez called Quantrix Authority. Rich has been using the tool for years and has shared over 325 videos explaining how he uses the tool in his daily work and how various functions and features work.
Vendor-Listed Capabilities Not Covered in This Review:
Quantrix Qloud Model/Tagging/Checkout
Low-code model-based app development
Multi-user cloud model editing
Model versioning and formula diff-merge
Role-based security and permissions
Automation and scripting language
SDK for custom extensions
Model Optimization/Solver